What and how to measure - Dynamic measurements
Introduction
In AC magnetic measurements, a small AC drive magnetic field is superimposed on the DC field, causing a time-dependent moment in the sample. The field of the time-dependent moment induces a current in the pickup coils, allowing measurement without sample motion. The detection circuitry is configured to detect only in a narrow frequency band, normally at the fundamental frequency (that of the AC drive field). In order to understand what is measured in AC magnetometry, first consider very low frequencies, where the measurement is most similar to DC magnetometry. As long as the AC field is small, the induced AC moment is MAC = (dM/dH) . HAC sin(ωt) where HAC is the amplitude of the driving field, ω is the driving frequency, and χ = dM/dH is the slope of the M(H) curve, called the susceptibility.
AC Susceptibility
Img src
The susceptibility is the quantity of interest in AC magnetometry. AC magnetic susceptibility measurement yields two quantities: the magnitude of the susceptibility, χ , and the phase shift, ϕ (relative to the drive signal). Alternately, one can think of the susceptibility as having an in-phase, or real, component χ' and an out-of-phase, or imaginary, component χ" . The two representations are related by
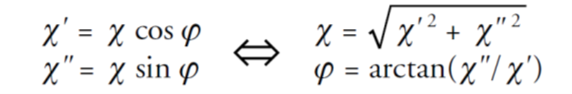
In the limit of low frequency where AC measurement is most similar to a DC measurement, the real component χ' is just the slope of the M(H) curve discussed above. The imaginary component, χ" , indicates dissipative processes in the sample.
In the higher frequency case, the magnetization of the sample may lag behind the drive field, an effect that is detected by the magnetometer circuitry.
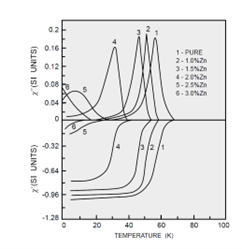
AC susceptibility is the standard tool for determining the physics of superconductors, in particular for measuring critical temperature. In the normal state (above the critical temperature), superconductors typically have a small susceptibility. In the fully superconducting state, the sample is a perfect diamagnet
and so χ' = –1. Typically, the onset of a significant nonzero χ' is taken as the superconducting transition temperature.example of AC susceptibility of the high-temperature superconductor as shown in the figure for a high-temperature superconductor LaBaCa(Cu1-xZnx)O7- δ.
Article src: https://qdusa.com/siteDocs/appNotes/1078-201.pdf
AC Hysteresisgraph

Img src
In order to understand what is measured in AC magnetometry, first consider very low frequencies, where the measurement is most similar to DC magnetometry. In this case, the magnetic moment of the sample follows the M(H) curve that would be measured in a DC experiment.
As the DC applied magnetic field is changed, different parts of the M(H) curve are accessed, giving a different susceptibility.
One advantage of the AC measurement is already evident: the measurement is very sensitive to small changes in M(H) . Since the AC measurement is sensitive to the slope of M(H) and not to the absolute value, small magnetic shifts can be detected even when the absolute moment is large.
At higher frequencies, the AC moment of the sample does not follow along the DC magnetization curve due to dynamic effects in the sample.
Article src: https://qdusa.com/siteDocs/appNotes/1078-201.pdf
Magnetic Resonance

Ferromagnetism is used to characterize magnetic behavior of a material, such as the strong attraction to a permanent magnet. The origin of this strong magnetism is the presence of a spontaneous magnetization which is produced by a parallel alignment of spins. The resonance arises when the energy levels of a quantized system of electronic or nuclear moments are Zeeman split by a uniform magnetic field and the system absorbs energy from an oscillating magnetic field at sharply defined frequencies corresponding to the transitions between the levels. Classically, the resonance event occurs when a transverse ac field is applied at the Larmor frequency.
The resonance behaviour usually called magnetic resonance (MR) with certain types regarding the entity that follows a resonance: FMR: FerroMagnetic Resonance for interacting spins, EPR: Electron Paramagnetic Resonance for isolated ionic spins, or NMR: Nuclear Magnetic Resonance for nuclei (NMR). Resonance effects are associated with the spin waves and the domain walls. The resonance methods are important for investigating the structure and magnetic properties of solids and other materials. These methods are used for imaging and other applications.
Magnetic Resonance (MR) is a research branch which examines magnetic properties of matters. The magnetic properties of atom originate from electrons and nucleus. So, it is studied in two groups such as electron paramagnetic resonance (EPR)/electron spin resonance (ESR) and nuclear magnetic resonance (NMR). At ESR and NMR the sample is placed in a strong static magnetic field and subjected to an orthogonally amplitude-frequency. While EPR uses a radiation of microwave frequency in general, NMR is observed at low radio frequency range. The energy absorption occurs when radio frequency is equal with energy difference between electrons two levels. But, the transition must obey the selection rules. The splitting between the energy levels occurs when total angular moment of electron is different from zero. On the other hand, the splitting of energy levels has not been observed in the filled orbit. The precession motion of a paramagnetic sample in magnetic field is seen schematically in left figure. This precession movement continue indefinitely would take forever when there is no damping force. The damping term may be introduced in different ways.
 Img src |
 Img src |
|
Schematic representation of precession of a single magnetic moment m in the external magnetic field around the z-axis. |
(a) EPR experimental signal for La0.7Ca0.3MnO3 at room temperature (b)) Theoretical FMR spectra calculated at parallel (θ=90ο, ~ 2000 G) and perpendicular (θ=0ο,~7000 G) position (c) The theoretical (red dot line) and experimental SPR (continuous black line) FMR spectra for Ni nanowires. (d) The theoretical SPR SPR (SuperParaMagnetic Resonance) signal for superparamagnet at room temperature. |
Article src: Yalçın, Orhan. Ferromagnetic Resonance. InTech, 2013. DOI: 10.5772/56134